SMA vs EMA: Simple vs Exponential Moving Average Explained
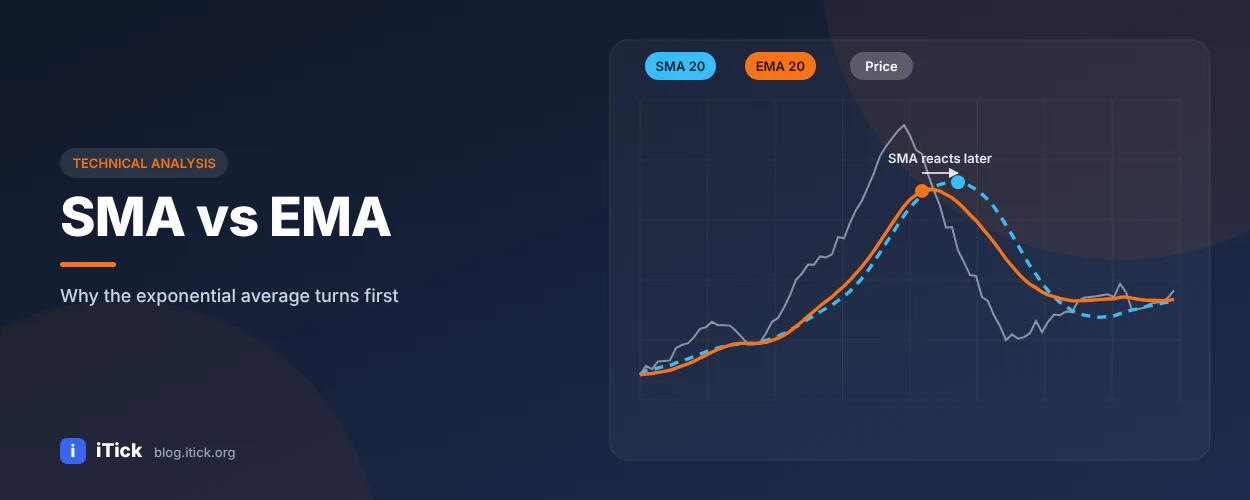
SMA vs EMA: Simple vs Exponential Moving Average Explained
Moving averages are the most widely used indicators in technical analysis. The two you will see on almost every chart are the SMA (Simple Moving Average) and the EMA (Exponential Moving Average). They look similar, but they behave differently - and choosing the right one changes how early (and how often) your strategy reacts.
What is SMA in stocks?
SMA stands for Simple Moving Average. It is the arithmetic mean of the last N closing prices. A 20-day SMA adds up the last 20 daily closes and divides by 20. Each day, the oldest price drops out and the newest is added, so the average "moves" along the chart.
Simple moving average formula
SMA_N = (P1 + P2 + ... + PN) / N
Example - a 5-day SMA of closes 10, 11, 12, 11, 13:
SMA = (10 + 11 + 12 + 11 + 13) / 5 = 11.4
Every price in the window carries exactly the same weight (1/N).
What is EMA?
The EMA also averages prices, but weights recent prices more heavily using a smoothing factor α = 2 / (N + 1). The full formula and a worked example are in our guide What is EMA? Exponential moving average explained.
SMA vs EMA: key differences
| SMA | EMA | |
|---|---|---|
| Weighting | Equal weight for every bar | More weight on recent bars |
| Reaction speed | Slower | Faster |
| Noise / false signals | Fewer | More |
| Memory | Only the last N bars | All past bars (decaying influence) |
| Best for | Long-term trend, support/resistance levels | Short-term momentum, timely entries |
| Classic settings | 50 SMA, 200 SMA | 9, 12, 21, 26 EMA |
The practical takeaway: the EMA hugs price more closely and turns sooner; the SMA is calmer and turns later. On a sharp reversal the EMA will usually cross price a few bars before the SMA does.
When to use SMA and when to use EMA
Use the SMA when:
- You trade on higher timeframes (daily, weekly) and want to avoid whipsaws.
- You follow widely watched levels - the 50-day and 200-day SMA are reference points for many institutional traders.
- You want a stable baseline for mean-reversion strategies.
Use the EMA when:
- You trade intraday or swing positions where timing matters.
- You build momentum indicators (MACD uses the 12 and 26 EMA).
- The market trends strongly and you want trailing stops that keep up with price.
Many traders combine both - for example a fast EMA for entries and a 200 SMA as a long-term trend filter.
Calculate SMA and EMA in Python
      import requests
import pandas as pd

TOKEN = "YOUR_API_TOKEN"
url = "https://api.itick.org/forex/kline"
params = {"region": "GB", "code": "EURUSD", "kType": 8, "limit": 300}
headers = {"accept": "application/json", "token": TOKEN}

data = requests.get(url, params=params, headers=headers, timeout=10).json()["data"]
df = pd.DataFrame(data)
df["close"] = df["c"].astype(float)

df["sma_20"] = df["close"].rolling(window=20).mean()
df["ema_20"] = df["close"].ewm(span=20, adjust=False).mean()

# How far apart are they? A widening gap signals accelerating trend
df["gap"] = df["ema_20"] - df["sma_20"]
print(df[["close", "sma_20", "ema_20", "gap"]].tail())
The same code works for stocks (/stock/kline, region US, code AAPL) or crypto (/crypto/kline, region BA, code BTCUSDT). Data comes from the iTick historical data API.
A simple test: which crosses first?
Run both averages over the same market and count how many bars after a trend change each one crosses price. You will typically find the EMA reacts earlier but also generates more crossings in sideways periods. That trade-off - speed vs reliability - is the whole SMA vs EMA debate in one experiment. To evaluate it properly, follow our Python backtesting tutorial.
FAQ
What does SMA mean in stocks? SMA means Simple Moving Average - the average closing price over a set number of periods.
Is the 200-day moving average SMA or EMA? It is most often quoted as an SMA, though some platforms default to EMA. Check your chart settings.
Which is better for day trading, SMA or EMA? Most day traders prefer EMAs because they respond faster to intraday price changes.
Can I use SMA and EMA together? Yes. A common setup uses a short EMA for signals and a long SMA as a trend filter.
Start building with real data
Moving averages need clean, gap-free prices. Get a free iTick API key for stock, forex and crypto OHLCV data, and stream live prices over WebSocket to keep your averages updated in real time.